Executive Summary
Food and drink waste in the UK presents significant economic, environmental, and logistical challenges. Over the past three years, waste levels have plateaued, with increases observed post-pandemic. This paper analyses food and drink waste trends across manufacturing, retail, and supply chain sectors, quantifies economic and environmental impacts, and highlights strategies for waste reduction.
Introduction
The UK generates substantial food waste, amounting to 10.7 million tonnes (Mt) per year as of 2021. The food supply chain—including manufacturing (13%), retail (2%), and logistics—accounts for a significant portion of this waste. The financial impact is estimated at £21.8 billion annually, with greenhouse gas emissions reaching 18 Mt CO2-equivalent. This whitepaper examines sector-specific challenges, waste drivers, and mitigation efforts.
Food Waste by Sector
Manufacturing Sector
- Annual Waste: 1.3–1.4 Mt (~13% of total food waste)
- Financial Impact: £0.85 billion in lost product value
- Key Waste Drivers:
- Overproduction due to inaccurate demand forecasts
- Quality control rejections based on strict standards
- Inefficiencies in ingredient storage and handling
- Canceled orders leading to surplus disposal
- Mitigation Strategies:
- Lean manufacturing and demand forecasting tools
- Redistribution partnerships for surplus food (e.g., FareShare)
- Process optimisation to reduce losses during production
Retail Sector
- Annual Waste: 0.2 Mt (~2% of total food waste)
- Financial Impact: £0.74 billion
- Key Waste Drivers:
- Short product shelf life and expiration-driven disposal
- Overstocking due to demand fluctuations
- Cosmetic standards leading to product rejection
- Limited redistribution of surplus food
- Mitigation Strategies:
- Dynamic pricing and markdowns for near-expiry items
- Removal of “best-before” dates on fresh produce
- Expansion of food redistribution programs
Supply Chain & Logistics
- Estimated Waste: Several hundred thousand tonnes per year
- Key Waste Drivers:
- Damage and spoilage during transportation
- Inefficiencies in packaging and cold chain logistics
- Poor inventory management and order mismatches
- Mitigation Strategies:
- Advanced tracking for perishable goods
- Optimised packaging to reduce damage risk
- Real-time demand alignment between suppliers and retailers
- Working with specialists in the food and beverage industry to mitigate and resolve problem inventory.
Visual Data Representation
To better illustrate the distribution and impact of food waste across sectors, the following charts provide a breakdown of waste in the UK:
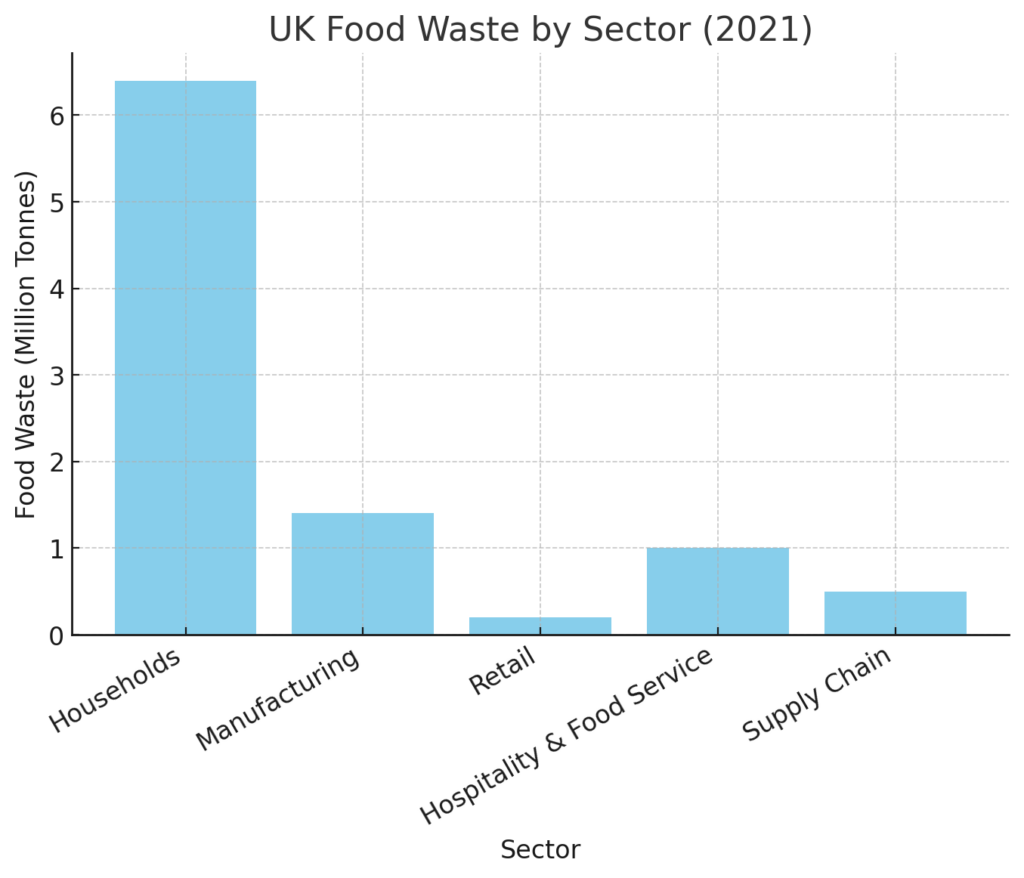
- Bar Chart: UK Food Waste by Sector (2021) – Illustrates food waste in million tonnes per sector.
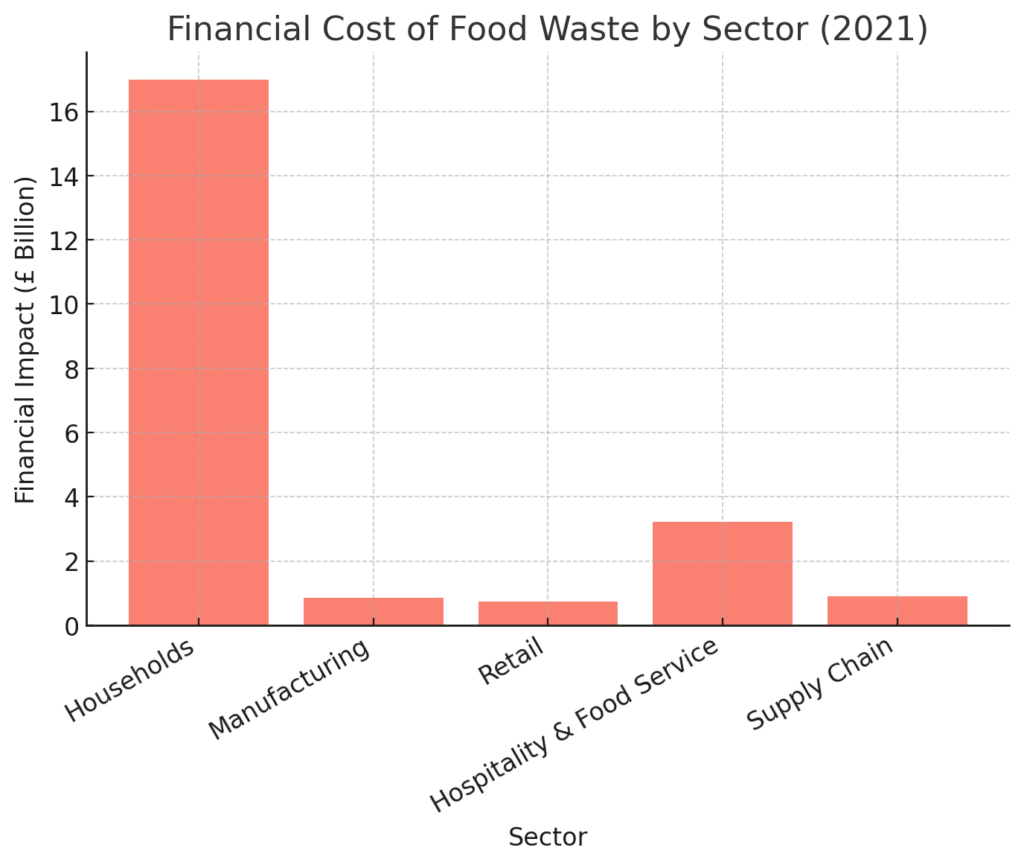
- Bar Chart: Financial Cost of Food Waste by Sector (2021) – Shows the economic impact of waste in billion GBP.
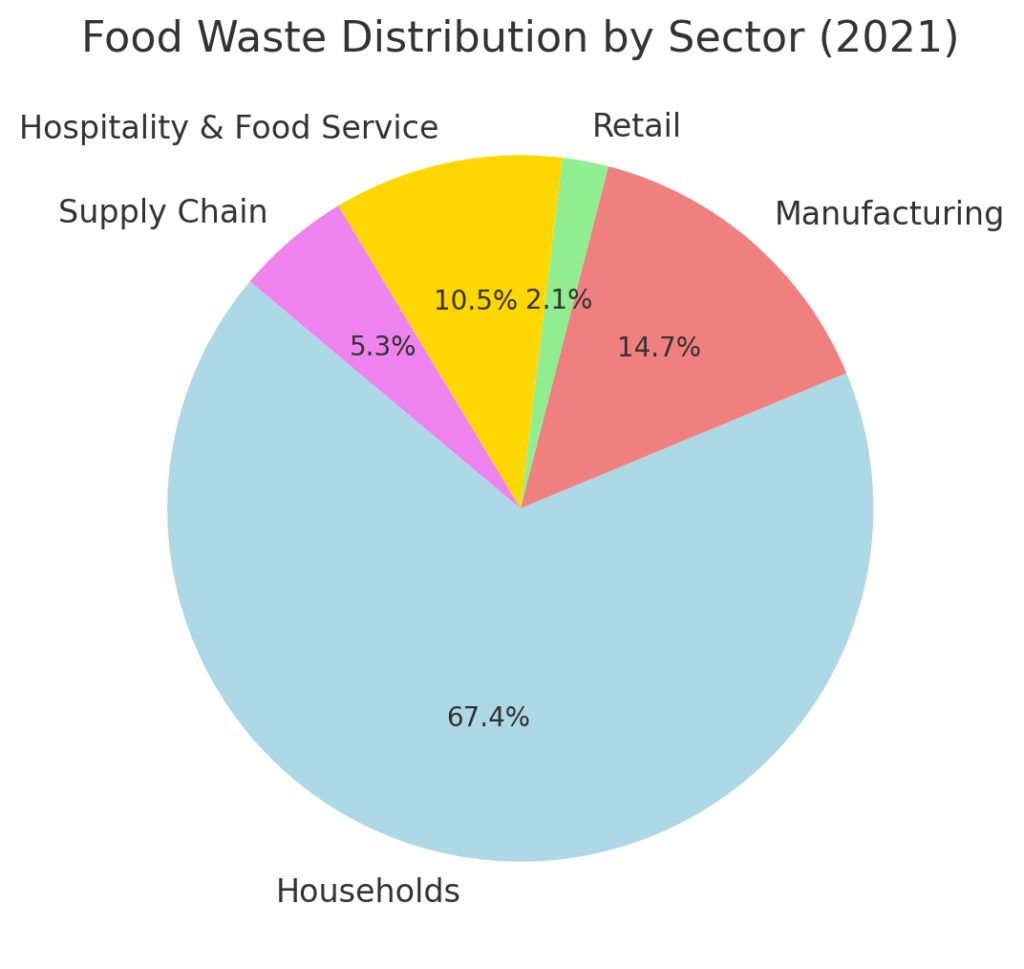
- Pie Chart: Food Waste Distribution by Sector (2021) – Represents the proportion of total waste each sector contributes.
Trends and Policy Developments (2021-2024)
- Post-2018 Increase: Food waste levels rose by 5.6% between 2018 and 2021.
- Impact of COVID-19: Temporary 34–43% decrease in household food waste in 2020, followed by a return to pre-pandemic levels in 2021.
- Manufacturing & Retail Reductions: >27% decline in manufacturing waste over a decade due to efficiency improvements.
- UK Targets & EU Comparisons: UK aims for a 50% reduction by 2030; EU food waste per capita remains stable at 132 kg per year.
- Potential Regulatory Changes: UK government considering mandatory food waste reporting for large businesses.
Conclusion & Recommendations
Key Findings:
- Manufacturing and retail improvements are driving gradual reductions, but total food waste remains high.
- Supply chain inefficiencies and last-minute cancellations continue to drive surplus disposal.
- Households remain the largest source of food waste, requiring more behavioral interventions.
Recommendations:
- Expand mandatory food waste reporting to enhance accountability.
- Invest in redistribution infrastructure to improve surplus food utilisation.
- Working with specialists in the food and beverage industry, such as ourselves.
- Strengthen retailer-manufacturer coordination to align production with real demand.
- Leverage technology (AI-driven demand forecasting, smart packaging) to reduce spoilage and inefficiencies.
References & Data Sources
- WRAP UK Food Waste Reports (2021-2024) – Link
- UK House of Commons Library briefing on food waste – Link
- UK Food Security Report 2024 – Link
- Eurostat data on food waste in the EU – Link
Refresh Surplus Report